Wealth
Charting The Growing Generational Wealth Gap
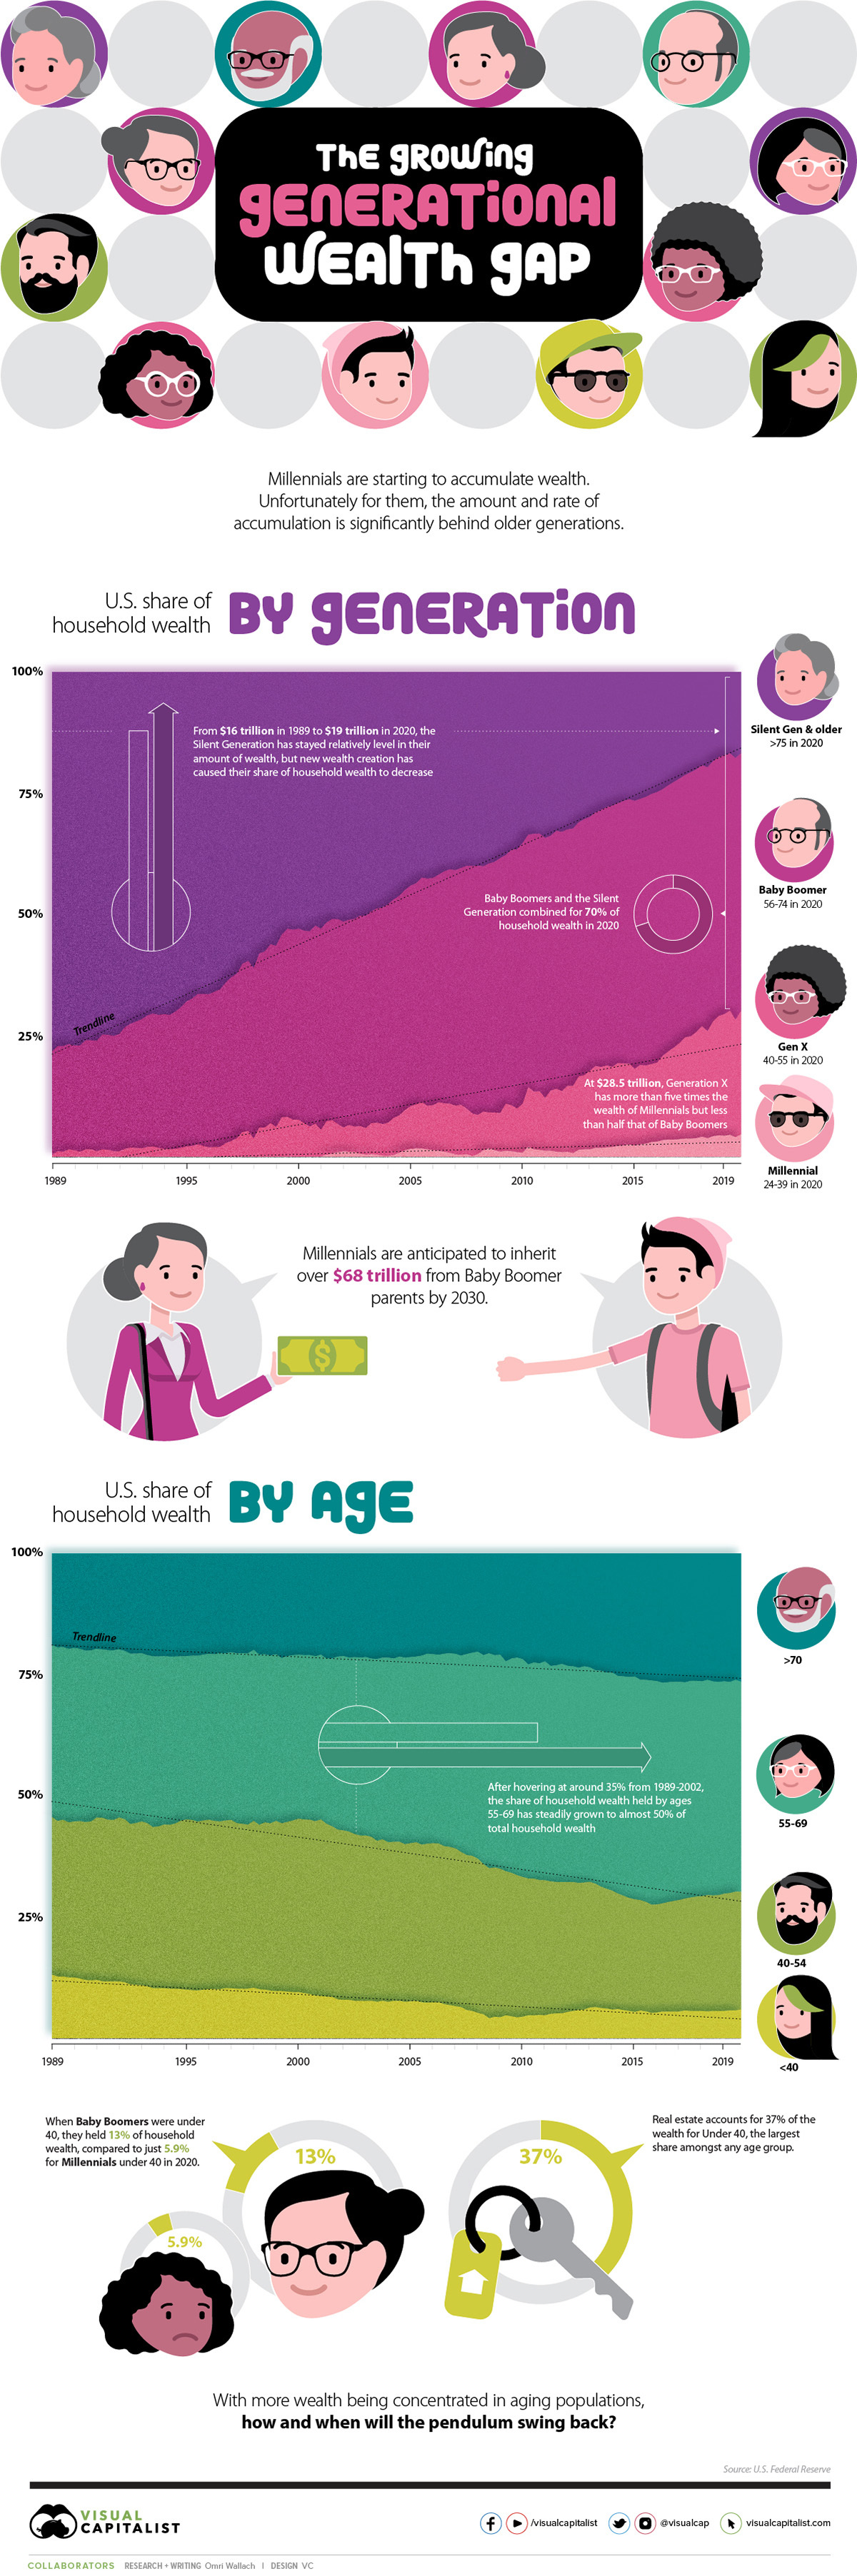


The Growing Generational Wealth Gap
As young generations usher into adulthood, they inevitably begin to accumulate and inherit wealth, a trend that has broadly remained consistent.
But what has changed recently is the rate of accumulation.
In the U.S., household wealth has traditionally seen a relatively even distribution across different age groups. However, over the last 30 years, the U.S. Federal Reserve shows that older generations have been amassing wealth at a far greater rate than their younger cohorts.
As the visual above shows, the older have been getting richer, and the younger have been starting further back than ever before.
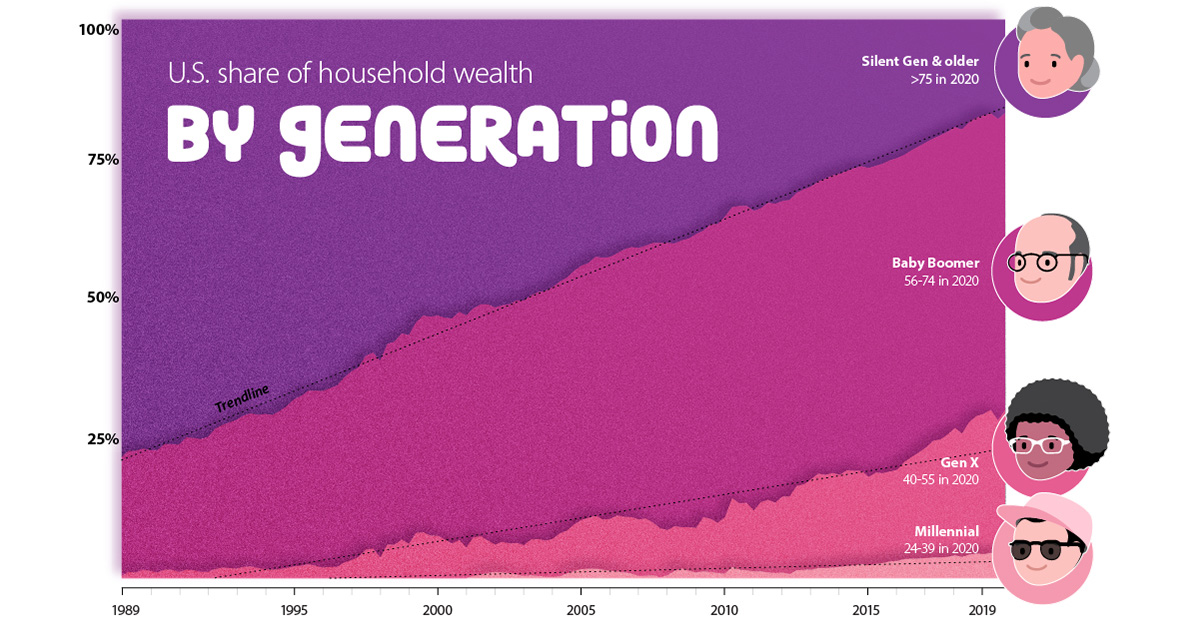
By Generation: Baby Boomers Benefit & Millennials Lag
To examine the proportion of wealth each generation holds, it’s important to clearly define each age group. Though personal definitions might differ, the U.S. Federal Reserve uses a clear metric:
| Generation | Birth Years | Age (2020) |
|---|---|---|
| Silent Generation & Earlier | 1945 and earlier | 75+ |
| Baby Boomers | 1946–1964 | 56–74 |
| Generation X | 1965–1980 | 40–55 |
| Millennials | 1981–1996 | 24–39 |
Relative to younger generations growing up, the Silent Generation and Greatest Generation before them have seen a decreasing share of household wealth over the last 30 years.
However, the numerical levels have been relatively stable. For these combined generations, total wealth has gone from $16 trillion in 1989 to $19 trillion in 2019, with a peak of $27 trillion in 2007. Considering this cohort has understandably shrunk over time—from an estimated 47 million to 23 million in 2019—their individual shares of wealth have actually increased.
Immediately following are the Baby Boomers, who held more than half of U.S. household wealth towards the end of 2020. At $59 trillion, the generation holds more than ten times the amount held by a comparative number of Millennials.
| Generation | Wealth (2019) | Population (2019) | Wealth/Person |
|---|---|---|---|
| Silent Generation & Older | $18.8 Trillion | 23.0 Million | $817,391 |
| Baby Boomers | $59.4 Trillion | 71.2 Million | $834,270 |
| Generation X | $28.6 Trillion | 65.0 Million | $440,000 |
| Millennials | $5.0 Trillion | 72.6 Million | $68,871 |
With $29 trillion held in 2019, Generation X has also been gaining in wealth over the last 30 years. It’s good enough for five times the wealth of Millennials, though at just $440k/person, they’ve fallen far behind Baby Boomers in rate of growth.
Finally, trying to catch up to their older cohorts are Millennials, who held the least amount of household wealth ($5 trillion) for the greatest population (73 million) in 2019, an average of just under $69k/person.
For a direct comparison, it took Generation X nine years to climb from their start of 0.4% of household wealth in 1989 to above 5%, while Millennials still haven’t crossed that threshold. But it’s not all doom and gloom for Millennials. Their rate of growth is starting to rise, with the generation’s level of wealth climbing from $3 trillion in 2016 to $5 trillion in 2019.
By Age: A Growing Share for 55+
Though the generational picture is stark, the difference in U.S. household wealth by age makes the picture of shifting wealth even clearer.
Until 2001, the shares of household wealth held by different age groups were relatively stable. People aged 40-54 and 55-69 held around 35% each of household wealth, retirees aged 70+ hovered around 20%, and younger people aged under 40 held around 10%.
Since that time, however, the shift in wealth to older generations is clear. The 70+ age group has seen their share of wealth increase to 26%, while the share held by ages 55-69 has grown from 35% to almost half.
But not all ages are seeing an increasing slice of wealth. The 40-54 age group saw its share drop sharply from 36% to 22% between 2001 and 2016 before starting to recover towards the end of the decade, while the youngest cohort now hover around just 5%.
Breaking down that wealth by components is even more eye-opening. The 39 and under age group holds 37.9% of their assets in real estate, the largest share amongst any age group (and concentrated in the hands of fewer people) while older age groups have their wealth spread out across real estate, equities, and pensions.
| Assets Held by Age (Percent of Total, 2020) | 70+ | 55–69 | 40–54 | ≤39 |
|---|---|---|---|---|
| Real estate | 21.6% | 20.5% | 27.6% | 37.9% |
| Consumer durables | 3.8% | 3.6% | 5.2% | 9.4% |
| Corporate equities and mutual fund shares | 24.6% | 23.1% | 18.6% | 8.1% |
| Pension entitlements | 16.3% | 25.0% | 21.9% | 21.0% |
| Private businesses | 7.9% | 9.7% | 12.1% | 8.1% |
| Other assets | 25.8% | 18.1% | 14.7% | 15.5% |
But the difference is as much in assets as it is in opportunity. In 1989, Baby Boomers and Generation X under 40 accounted for 13% of household wealth, compared to just 5.9% for Millennials and Generation Z under 40 in 2020.
Will the Tide Turn for Generation Z?
As new and accumulated wealth has been built up in older generations, it’s a matter of time before the pendulum starts to swing the other way.
The Millennials age group are expected to inherit $68 trillion by 2030 from Baby Boomer parents. Of course, that payout isn’t going to be even across the board, with wealthier families retaining the bulk of wealth and the majority of Millennials laden with debt.
And with Generation Z (born 1997-2012) starting to come of age, the uneven playing field is making it hard to begin accumulating wealth in the first place.
Since it is in the best interest of societies to have wealthy generations that can drive economic growth, potential solutions are being examined all over the political sphere. They include different taxation schemes, changing estate laws, and potentially cancelling student debt.
Whatever ends up happening, it’s important to track how the distribution of wealth changes over the coming decade, and begin accumulating your personal wealth as best as you can.


Money
Charted: Which Country Has the Most Billionaires in 2024?
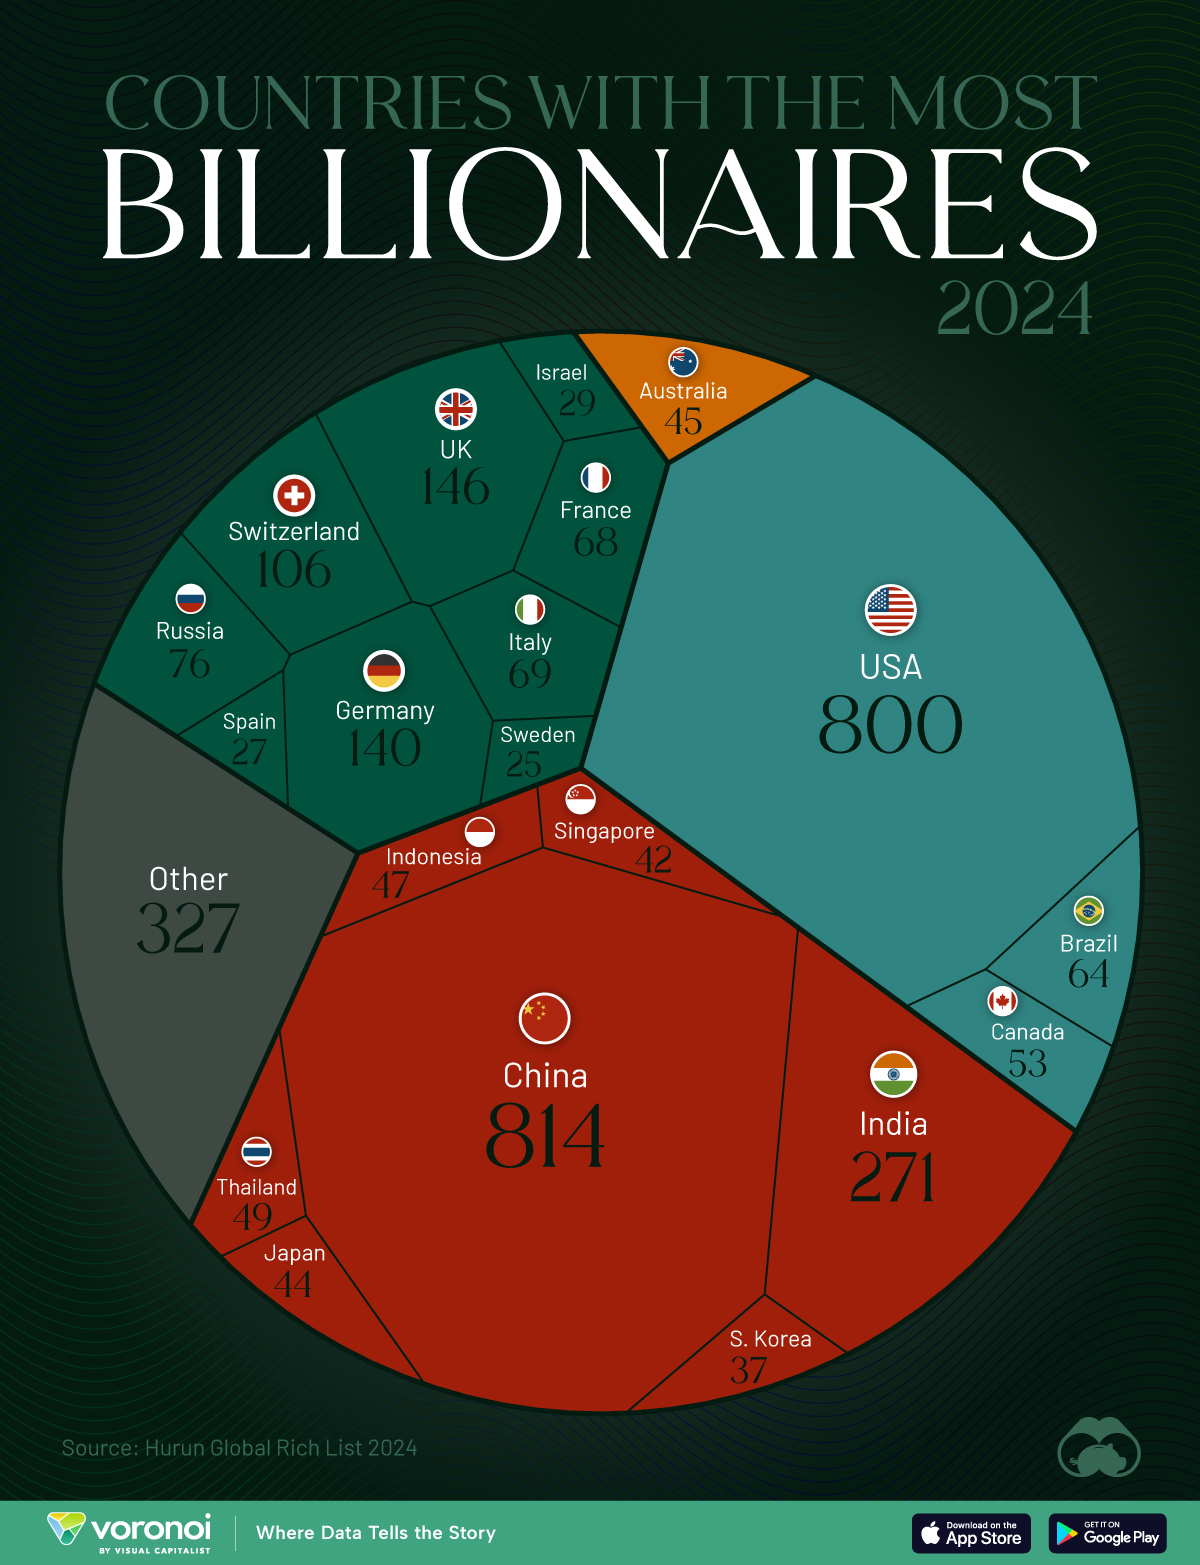
According to the annual Hurun Global Rich List, the U.S. and China are home to nearly half of the world’s 3,279 billionaires in 2024.
Charted: Which Country Has the Most Billionaires in 2024?
This was originally posted on our Voronoi app. Download the app for free on iOS or Android and discover incredible data-driven charts from a variety of trusted sources.
The world has always had people with incredible wealth: from Roman emperors to John D. Rockefeller who became the world’s first billionaire in measurable dollars. But where do the very wealthiest people live right now?
We visualize the countries with the most billionaires in 2024, sourced from the annual Hurun Global Rich list. A country and city aggregate is also available here.
A caveat to this data. Total wealth estimates are notoriously difficult to get right, and different sources can vary in their billionaire data. For example, Forbes, switches ranks for the U.S. and China, though the overall top three remain the same.
Forbes also has Bernard Arnault as the current richest individual, while Hurun places Elon Musk atop the ranks. Nevertheless, their overall top 10 is similar with a few ranking differences.
Ranked: Countries with the Most Billionaires in 2024
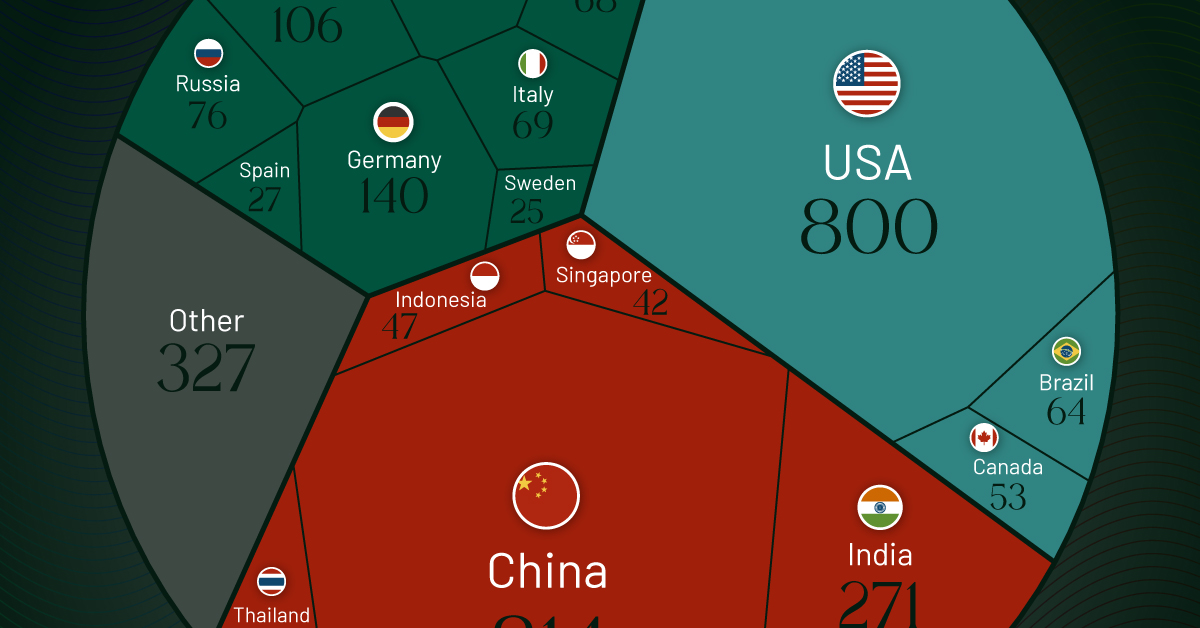
China has 814 billionaires, the most in the world, according to the Hurun Global Rich List 2024. Despite holding on to the top spot, China lost 155 billionaires year-over-year, while the U.S. gained 109. The gap between the two countries has now reduced to just 14 billionaires.
| Rank | Country | Billionaires | Change YoY |
|---|---|---|---|
| 1 | 🇨🇳 China | 814 | -155 |
| 2 | 🇺🇸 U.S. | 800 | +109 |
| 3 | 🇮🇳 India | 271 | +84 |
| 4 | 🇬🇧 UK | 146 | +12 |
| 5 | 🇩🇪 Germany | 140 | -4 |
| 6 | 🇨🇭 Switzerland | 106 | +6 |
| 7 | 🇷🇺 Russia | 76 | +6 |
| 8 | 🇮🇹 Italy | 69 | +11 |
| 9 | 🇫🇷 France | 68 | -4 |
| 10 | 🇧🇷 Brazil | 64 | +13 |
| 11 | 🇨🇦 Canada | 53 | +8 |
| 12 | 🇹🇭 Thailand | 49 | +3 |
| 13 | 🇮🇩 Indonesia | 47 | +12 |
| 14 | 🇦🇺 Australia | 45 | 0 |
| 15 | 🇯🇵 Japan | 44 | +12 |
| 16 | 🇸🇬 Singapore | 42 | +5 |
| 17 | 🇰🇷 South Korea | 37 | +4 |
| 18 | 🇮🇱 Israel | 29 | +9 |
| 19 | 🇪🇸 Spain | 27 | +1 |
| 20 | 🇸🇪 Sweden | 25 | -2 |
| N/A | 🌍 Other | 327 | N/A |
Together, the U.S. and China account for nearly half of the 3,279 billionaires globally, leagues ahead of closest peers, #3 India (271) and #4 UK (146).
Collectively however, European countries account for six of the top 10 and eight of the top 20 countries with the most billionaires.
Naturally, the world’s largest economies tend to be overrepresented on billionaire counts, as they provide more opportunities for wealth creation.
Switzerland, Singapore, and Sweden are outliers in this regard, with only one of them making the top 20 economies by total gross domestic product.
All three countries are perceived to have high tax rates, generally not conducive to amassing wealth. But perceptions can be misleading. Sweden, for example, has no inheritance tax, a flat rate on capital gains, and a corporate tax rate at 21%.

-

 Markets6 days ago
The Top Private Equity Firms by Country
-

 Countries2 weeks ago
Countries With the Largest Happiness Gains Since 2010
-

 Economy2 weeks ago
VC+: Get Our Key Takeaways From the IMF’s World Economic Outlook
-

 Demographics2 weeks ago
The Countries That Have Become Sadder Since 2010
-

 Money2 weeks ago
Charted: Who Has Savings in This Economy?
-

 Technology2 weeks ago
Visualizing AI Patents by Country
-

 Economy2 weeks ago
Economic Growth Forecasts for G7 and BRICS Countries in 2024
-

 Wealth1 week ago
Charted: Which City Has the Most Billionaires in 2024?